Plot interval dates
plot.dates.RdA function to plot interval dates with different forms.
# S3 method for dates
plot(x, y, type = c("ts", "mp", "rg"), taq, tpq, id, out,
    col, cex, lwd, lty, pch, main = NULL, xlab = NULL, ylab = NULL,
    xlim = NULL, axes = TRUE, alpha, file = NULL, ...)
<!-- %plot.dates(x, y, type = c("ts", "mp", "rg"), taq, tpq, id, out,  -->
<!-- %    col, cex, lwd, lty, pch, main = NULL, xlab = NULL, ylab = NULL,  -->
<!-- %    xlim = NULL, axes = TRUE, alpha, file = NULL, ...) -->
Arguments
- x
dataset as a data frame object of variables and observations.
- y
vector of identifiers (optional)
- type
Type of date format to plot:
tstimespans with endpointsmpmid points and rangergrange only- taq
timespan endpoint terminus ante quem (TAQ)
- tpq
timespan endpoint terminus post quem (TPQ)
- id
IDs as variable or rownames in dataset
x- out
integer or vector with number of outliers to omit (first entry id for latest date)
- col
color of
pch- cex
size of
pch- lwd
width of time interval segments
- lty
shape of time interval segments
- pch
symbol for
taqandtpq- main
plot's main tile
- xlab
plot's
xlabel- ylab
plot's
ylabel- xlim
plot's
xlimits- axes
plot's axes (logical)
- alpha
alpha transparency for time interval segments
- file
path to produce a file with a PDF format (optional)
- ...
additional optional parameters
Details
This plot function is for time interval segments given in the dataset x, which is
given as a dataframe or as a ``tibble'' class object.
Value
A graphical plot.
Note
If x is NULL, then EDH dataset is taken by default.
Examples
## Not run:
# first 100 entries in the EDH dataset
data("EDH")
#> Warning: data set ‘EDH’ not found
EDHdates <- edhw(vars=c("not_after", "not_before"), as="df", limit=100)
#> Warning: "x" is for dataset "EDH".
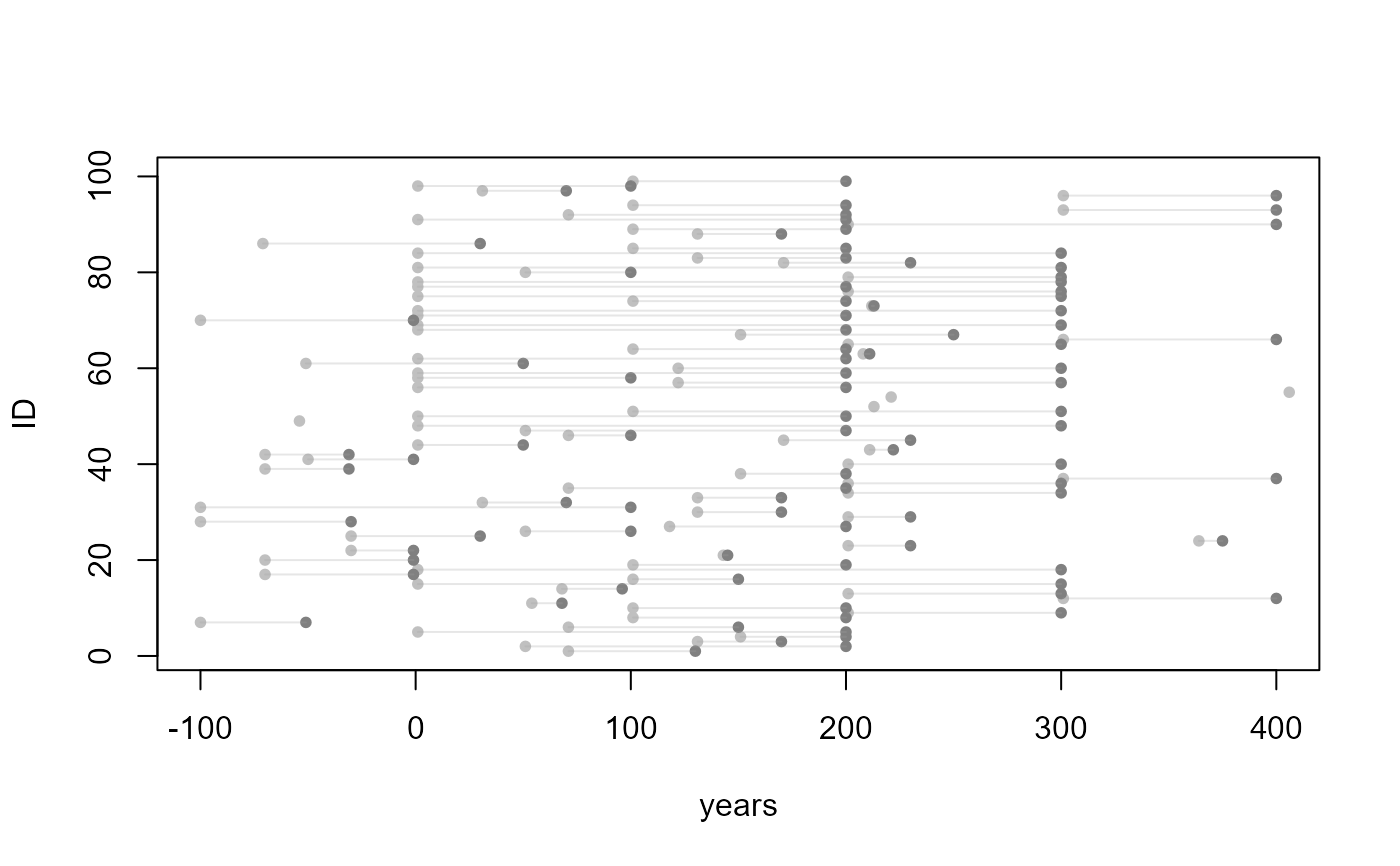
# timespans
plot.dates(EDHdates, taq="not_before", tpq="not_after")
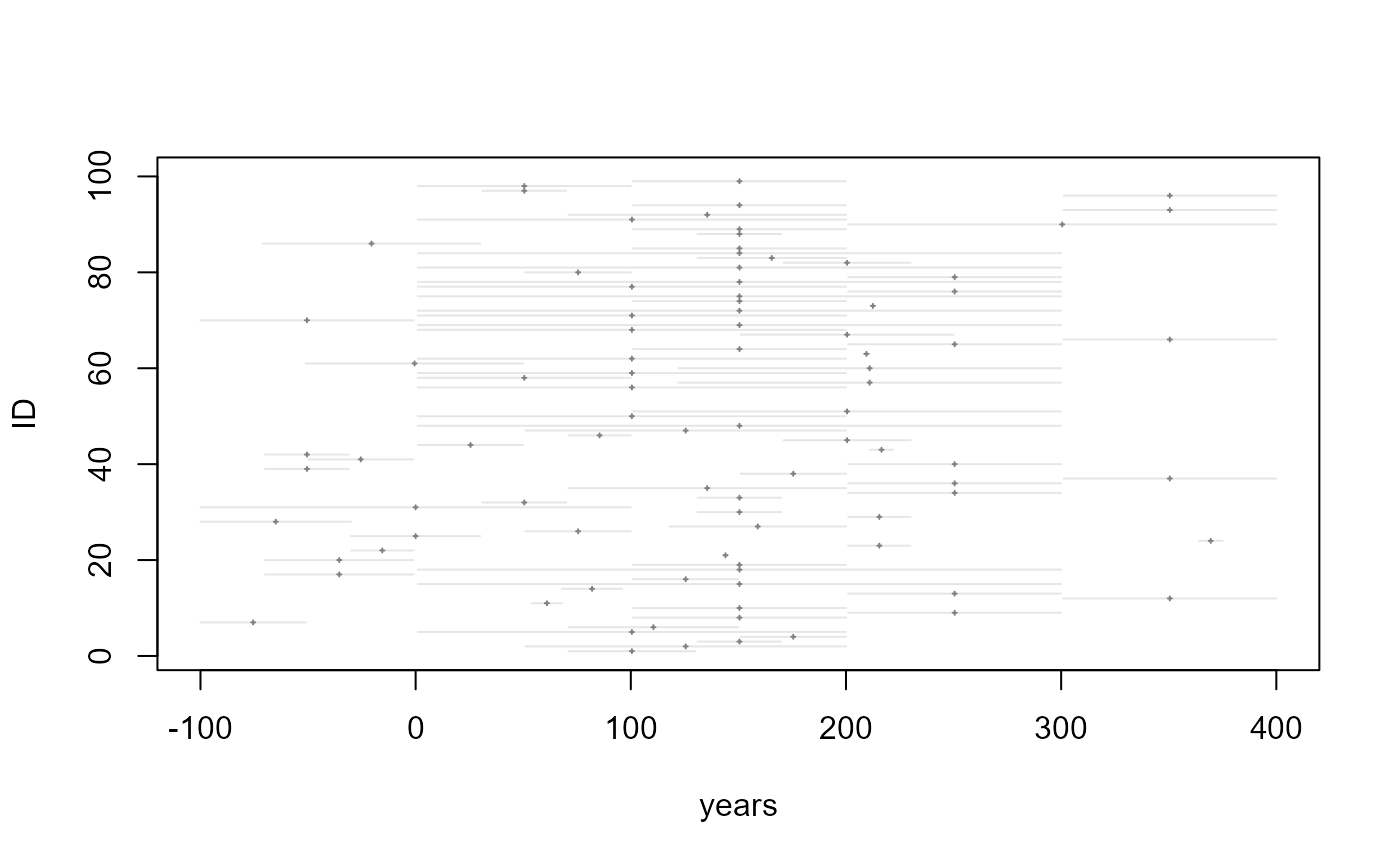
 # mid points
plot.dates(EDHdates, type="mp", taq="not_before", tpq="not_after")
# mid points
plot.dates(EDHdates, type="mp", taq="not_before", tpq="not_after")
 ## End(Not run)